
Fleet Cost Guide · En Route Technologies
Quick answer: To implement cost per vehicle analytics, give each vehicle a unique ID, map every cost, connect telematics, fuel, fleet maintenance, toll and lease data, set allocation rules, build dashboards and review results monthly. An integrated fleet platform such as En Route Technologies automates the data and shows cost per kilometer, hour or delivery for every vehicle.
Table of contents
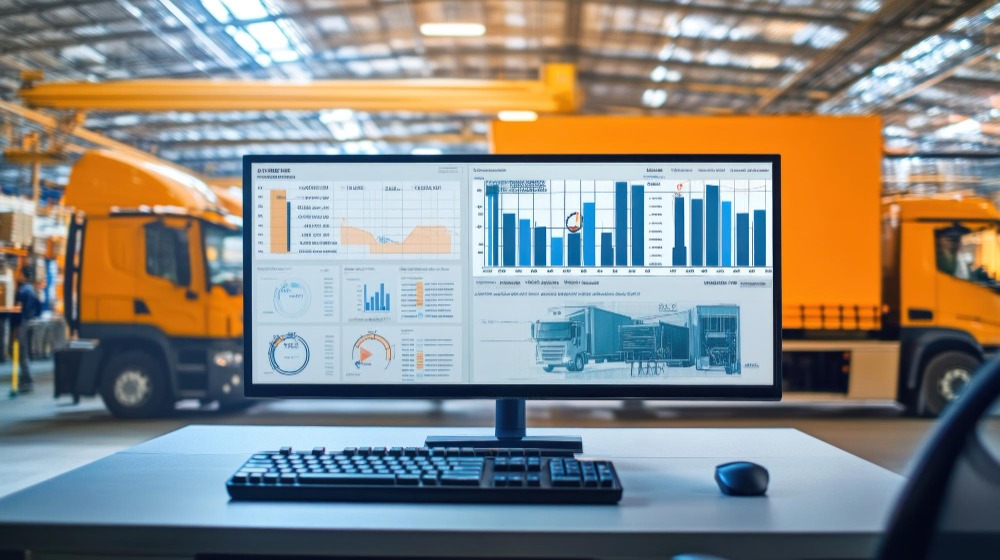
Cost per vehicle analytics is the practice of adding every cost of running a vehicle and dividing it by time, distance or jobs. The result shows what each truck really costs. For UAE transport companies, this answer matters more every month. Diesel rose from AED 3.80 per liter in August 2026 to AED 4.80 in October. En Route Technologies helps fleets track cost per vehicle analytics through its reporting and analytics tools.
This guide explains how to implement cost per vehicle analytics step by step. First, we look at software choices and why cost answers are hard to find. Then we cover the cost components, the benefits, a rollout plan and total cost of ownership.
AED 4.80
UAE diesel price per liter in October 2026, set by the UAE Fuel Price Committee
+26%
Rise in the UAE diesel price from August 2026 (AED 3.80) to October 2026 (AED 4.80)
7 years
Minimum time UAE corporate tax records must be kept after each tax period, according to the Federal Tax Authority
The best software for cost per vehicle analytics is an integrated fleet management platform that pulls fuel, maintenance, toll, lease and telematics data into one dashboard. Spreadsheets and stand-alone accounting tools cannot link costs to real vehicle use. En Route Technologies offers this through its fleet management system and reporting and analytics.
| Tool Type | Strengths | Limits |
|---|---|---|
| Spreadsheets | Cheap and familiar | Manual entry, errors, no live data |
| Accounting software | Good for ledgers and VAT | Does not know mileage, idle time or driver use |
| Stand-alone fleet cost tools | Track expenses by vehicle | Often lack live telematics and workshop links |
| Integrated fleet platform | Live data, costs and maintenance in one place | Needs setup and clear cost rules |
Ask how the tool gets each cost. Does it read fuel from sensors or from receipts? Does it link tolls and fines to the right vehicle? Can it show cost per kilometer, per hour and per delivery? Also ask for a pilot on your own data. If a vendor cannot answer, keep looking.
UAE fleet operators cannot get a straight answer on cost because the data lives in many places and arrives at different times. Fuel statements, workshop invoices, toll accounts, fines, insurance renewals and payroll all sit in separate systems. So nobody adds them up by vehicle.
A single truck creates costs in at least six places. For example, the finance team holds lease or loan payments. The workshop holds repair invoices. Fuel cards hold fuel. The toll operator holds Salik charges. Traffic authorities hold fines. HR holds driver pay. As a result, nobody sees the full cost of one vehicle.
Fuel prices change every month. The UAE Fuel Price Committee set diesel at AED 3.80 per liter in August 2026, AED 4.30 in September and AED 4.80 in October. For a truck that burns about 28 liters per 100 km and drives 6,000 km a month, that is about AED 1,680 more in fuel each month. For 100 trucks, the extra cost reaches AED 168,000 a month.
Salik charges AED 6 per trip at peak times and AED 4 off-peak, with 5% VAT added from 1 June 2026. Fines often arrive weeks later. These small items slip through manual reports. Yet they add up across a fleet.
A 2025 survey of equipment fleets found that about 75% still rely on manual logs, alone or alongside digital tools. Manual entry creates delays and errors. So when the boss asks, “What does Truck 14 cost us per kilometer?”, the honest answer is often, “We will check.”
The key components of cost per vehicle analysis are fixed costs, variable costs, hidden costs and a clear unit of measure such as kilometer, hour or delivery. Good cost per vehicle analytics tracks all of them for every vehicle.
| Cost Group | Examples | Main Data Source |
|---|---|---|
| Fixed | Lease or loan payment, depreciation, insurance, registration, telematics fees | Contracts, finance, asset records |
| Variable | Fuel, tyres, oil, repairs, tolls, fines | Telematics, workshop, toll and fine records |
| People | Driver wages, overtime, allowances | Payroll and driver records |
| Hidden | Downtime, idle time, theft, admin time, late fees | Telematics, work orders, reports |
One total number is not enough. Divide costs by the unit that fits your business. Long-haul fleets use cost per kilometer. Construction and field fleets use cost per engine hour. Delivery fleets use cost per drop. Rental fleets use cost per rental day.
| Unit | Formula | Best For |
|---|---|---|
| Cost per kilometer | Total cost ÷ kilometers driven | Freight and distribution |
| Cost per hour | Total cost ÷ operating hours | Heavy equipment and field work |
| Cost per delivery | Total cost ÷ completed deliveries | Last-mile delivery |
| Cost per day | Total cost ÷ days in service | Rental and leasing |
However, hidden costs often hurt most. The U.S. Department of Energy says an idling heavy truck burns about 3 liters an hour. At AED 4.80 per liter, that is about AED 14 for every hour of idling. Downtime, late fees and unclaimed fines also drain money. Track them, because you cannot cut what you cannot see.
Some costs are shared, such as depot rent or software fees. Decide a rule early. For example, split them by vehicle count or by kilometers. Then apply the same rule every month. Consistent rules make comparisons fair.
The benefits of analyzing cost per vehicle include clearer budgets, lower fuel and repair costs, smarter vehicle replacement, fairer pricing and faster decisions. Strong cost per vehicle analytics turns data into money.
| Benefit | How It Happens | What to Track |
|---|---|---|
| Clear budgets | You know the real cost of each vehicle | Budget vs. actual by vehicle |
| Lower fuel cost | Idle time and wasteful driving become visible | Liters per 100 km; idle hours |
| Smarter maintenance | Repair costs show which vehicles to fix or replace | Maintenance cost per km |
| Better pricing | You price jobs from true cost, not guesses | Margin per route or customer |
| Right-sized fleet | Low-use vehicles are easy to spot | Utilization rate |
Every vehicle has a point where repairs cost more than a replacement. So cost data shows that point. Then you can sell a vehicle at the right time and protect its resale value.
When you know cost per kilometer or per delivery, you can price contracts with confidence. Also, you see which customers and routes make money. Then you can fix or drop the ones that do not.
Managers stop arguing over whose numbers are right. Instead, they look at one dashboard. As a result, decisions about routes, drivers and vehicles take minutes, not weeks.
To implement cost per vehicle analytics, define your scope, map every cost, connect your data sources, set allocation rules, build dashboards and review results every month. Start with one depot, then scale.
| Phase | Timing | Main Actions |
|---|---|---|
| Prepare | Days 1–30 | Scope, vehicle IDs, cost map, data sources |
| Connect | Days 31–60 | Link telematics, fuel, maintenance, tolls and leases; test numbers |
| Analyze | Days 61–90 | Build dashboards, set baseline, agree targets and review rhythm |
Cost data affects drivers, workshops and managers. So explain why you collect it. Share results openly. Also remember that driver data is personal data under the UAE Personal Data Protection Law, so keep access limited and tell drivers what you record.
En Route is a strong choice for cost per vehicle analytics in the UAE because it combines tracking, fuel, maintenance, inventory, lease and asset costs in one platform built for the region. It also offers a Lease Tool Calculator that models total cost of ownership with live fleet data.
En Route’s unified data model consolidates work orders, parts inventory and asset performance data into a single source of truth. Its reporting and analytics tools use customizable dashboards and ready-made reports to uncover financial insights about total cost of ownership. Multi-site reporting brings branches and countries into one view.
The lease management system links Salik and Darb tolls and municipal traffic fines to the active contract and the specific driver. It also sends alerts for insurance and registration expiries 30 days before renewal. These are everyday UAE costs that generic tools often miss.
Cost analytics also help automotive businesses. Workshops can use the workshop management system, and rental firms can use the car rental and leasing solutions. Logistics operators can see freight tools on the logistics and freight page.
En Route is a UAE-based provider with more than 20 years of experience, SIRA SecurePath Premium approval and ISO 9001:2015 certification. See its certifications and compliance page for details.
Our software tracks vehicle operating expenses by capturing data automatically at the source: sensors for fuel, work orders for repairs, contracts for tolls and fines, and asset records for depreciation. Each cost then attaches to the right vehicle for cost per vehicle analytics.
| Expense | How En Route Tracks It | Data Source |
|---|---|---|
| Fuel | Fuel trends, deficiency alerts and idle reports | Sensors, telematics and fuel records |
| Maintenance | Labor, parts and service costs per work order | Digital work orders and workshop data |
| Spare parts | Stock deducted when a part is added to a work order | Inventory records |
| Tolls and fines | Salik, Darb and fines linked to contract and driver | Toll and fine records |
| Lease and depreciation | Acquisition cost, depreciation, mileage and residual value | Asset and lease records |
| Insurance and registration | Expiry alerts 30 days before renewal | Vehicle documents |
| Driver impact | Idle time, harsh driving and efficiency scores | Telematics and Eco-Driving |
Fuel is usually the biggest variable cost. Therefore, En Route’s fuel monitoring unlocks fuel trend insight and spots deficiencies. Eco-Driving adds driver scores and idle reports, so you see which habits drive cost.
Each repair becomes a digital work order that tracks labor, parts and service costs, with vendor and invoice details. Parts leave stock automatically when added to the order. See work order management, inventory management and vehicle service history.
The asset management system tracks acquisition cost, depreciation, lifetime maintenance expenses and mileage. It also calculates residual value to support end-of-life sales. This is the fixed side of cost per vehicle analytics.
Downtime is a hidden cost. En Route’s fleet maintenance system uses live telemetry to trigger condition-based work orders before failures. Fewer breakdowns mean fewer lost days and lower repair bills.
Total cost of ownership equals the purchase or lease cost plus financing, running costs and end-of-life costs, minus residual value. It shows what a vehicle really costs over its whole life, not only on the invoice.
TCO = acquisition cost + financing cost + operating costs over the vehicle’s life − residual value. Operating costs include fuel, maintenance, tyres, insurance, registration, tolls, fines, driver cost and downtime. Divide TCO by total kilometers or hours to get a lifetime unit cost.
The numbers below are illustrative. They assume a truck that drives 6,000 km a month, uses 28 liters per 100 km and pays AED 4.80 per liter for diesel.
| Cost Item | Monthly Cost (AED) | How It Is Calculated |
|---|---|---|
| Lease or depreciation | 4,500 | Contract or asset record |
| Fuel | 8,064 | 6,000 km × 0.28 L × AED 4.80 |
| Maintenance and tyres | 1,200 | Work orders |
| Insurance and registration | 900 | Annual cost ÷ 12 |
| Driver cost | 4,500 | Payroll |
| Salik and Darb tolls | 600 | Toll records |
| Fines and admin | 270 | Fine records and fees |
| Total | 20,034 | Sum of the items above |
| Cost per kilometer | 3.34 | 20,034 ÷ 6,000 km |
Fuel alone is about 40% of this truck’s monthly cost. If diesel had stayed at the August price of AED 3.80, the fuel line would be AED 6,384, which is AED 1,680 lower. That is why current fuel data matters.
Total cost of ownership also guides buying decisions. En Route’s Lease Tool Calculator lets you compare owning and leasing across vehicle types, terms and mileage bands. It pulls actual mileage, maintenance history and fuel use from your fleet, and it factors in depreciation, residual value and end-of-lease mileage penalties. You can also compare several lease quotes on a normalized basis and export a PDF or Excel report for approval.
En Route reports that fleets using the tool achieve an average 15% reduction in total lease cost through data-driven negotiation, and AED 180,000 or more in average annual savings on standard 100-vehicle portfolios. Results depend on your contracts and fleet.
The Federal Tax Authority requires businesses to keep corporate tax records for at least seven years after each tax period. Vehicle cost records support your expense claims and depreciation, so store them in a system with a clear audit trail.
Cost per vehicle analytics gives UAE transport companies a straight answer about cost. It joins fuel, maintenance, tolls, fines, lease and driver data for each vehicle. With rising diesel prices and tight margins, that answer drives pricing, budgets and replacement decisions.
Pick one depot, map your costs and connect your data. Then review the numbers every month. En Route Technologies brings tracking, fuel, maintenance, lease and reporting together on one platform. Explore the fleet management system or contact the team to plan your pilot.
Cost per vehicle analytics adds every cost of running a vehicle, such as fuel, maintenance, tolls, fines, insurance, driver cost and depreciation. It then divides the total by kilometers, hours or deliveries to show the true cost of that vehicle.
Add all costs for a period, including fixed, variable and people costs, then divide by the kilometers driven in that period. For example, AED 20,034 of monthly cost over 6,000 km gives AED 3.34 per kilometer.
Cost per vehicle usually covers a period, such as a month. Total cost of ownership covers the whole life of the vehicle, from purchase or lease to sale, minus residual value.
Fleets often forget Salik and Darb tolls, fines that arrive late, idle fuel, downtime and admin time. Insurance and registration renewals can also slip through when they are not tracked.
A focused pilot can take about 90 days: 30 days to prepare, 30 days to connect data and 30 days to analyze and set targets. Larger fleets can then scale in phases.
Yes. En Route’s Lease Tool Calculator compares owning and leasing across vehicle types, terms and mileage bands, using real mileage, maintenance and fuel data from your fleet, and it exports a report for approval.
Fuel is often the largest variable cost, so price changes matter. A truck that uses 28 liters per 100 km and drives 6,000 km a month spends about AED 1,680 more when diesel rises from AED 3.80 to AED 4.80 per liter.
Driver and location data are personal data under the UAE Personal Data Protection Law (Federal Decree-Law No. 45 of 2021), and consent is its main legal basis. Tell drivers what you record, limit access and keep a written policy. This is general information, not legal advice.
Book a demo to see live fuel, maintenance, toll and lease costs come together in one cost per vehicle dashboard.