
Fleet Analytics Guide · En Route Technologies
Quick answer: Custom fleet dashboards improve operational efficiency by showing live fleet data and fleet management KPIs for each role on one screen. They also automate reports and maintenance reminders, and they expose waste in fuel, idle time and repairs. En Route Technologies offers customizable dashboards, role-based permissions and real-time analytics that connect to your existing tracking systems.
Table of contents
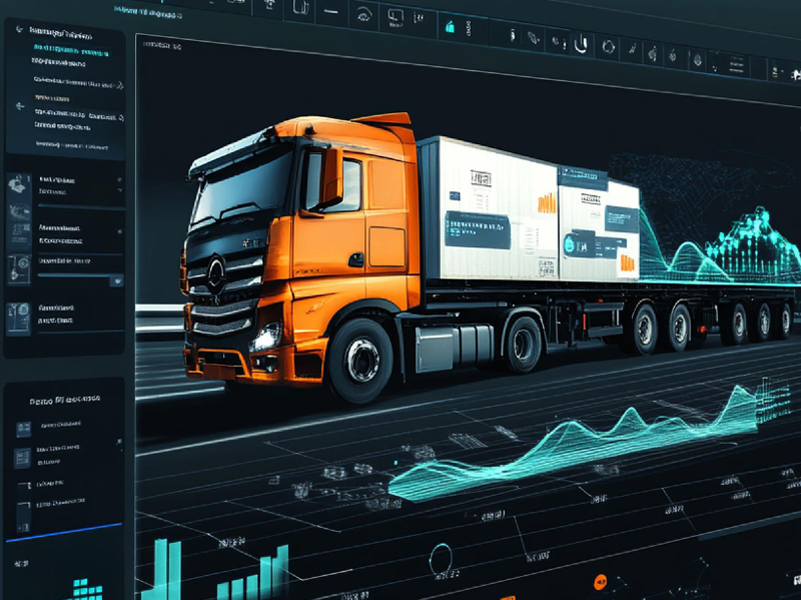
Custom fleet dashboards are configurable screens that show live fleet data and key performance indicators for each role in your company. A dispatcher sees vehicles and ETAs. The workshop manager sees services due. Meanwhile, a director sees cost per kilometer. This focus helps UAE logistics companies cut waste and react faster. En Route Technologies builds custom fleet dashboards through its reporting and analytics tools.
This guide explains how custom fleet dashboards improve operational efficiency. First, we compare paper and digital maintenance scheduling. Then we cover benefits, KPIs, features and integration.
55%+
Maintenance activity that is still reactive at the average facility, according to the U.S. Department of Energy
12–18%
Estimated cost saving of preventive over reactive maintenance, according to the U.S. Department of Energy
75%
Equipment fleets still using manual logs, alone or alongside digital tools, in a 2025 industry survey
Custom reporting tools beat manual paperwork for vehicle maintenance scheduling because they trigger services from real mileage and engine data, keep complete records and send reminders automatically. However, paper schedules rely on memory and luck. For logistics fleets in the GCC, custom fleet dashboards make this gap visible.
Paper schedules break in quiet ways. A form gets lost. Then a mileage reading turns out wrong. Meanwhile, a service date passes while the truck is on the road. Because the paper does not know what the vehicle is doing, it cannot warn anyone in time. As a result, many fleets fix vehicles only after they fail.
Custom tools read mileage, engine hours and fault codes straight from the vehicle. They then create reminders and work orders on their own. En Route’s fleet maintenance system uses live data to trigger condition-based work orders. The work order management tool tracks labor, parts and cost, and the vehicle service history keeps the full record.
| Task | Manual Paperwork | Custom Reporting Tools |
|---|---|---|
| Service reminders | Calendar notes and memory | Automatic alerts by mileage, hours or date |
| Fault detection | Driver reports a problem late | Live fault codes sent to the workshop |
| Service history | Paper files in many depots | One searchable digital record per vehicle |
| Spare parts | Counted by hand | Stock updated when parts are used |
| Cost visibility | Invoices added up later | Cost per vehicle by work order |
| Audit evidence | Hard to find and prove | Time-stamped, exportable records |
The U.S. Department of Energy’s O&M guide estimates that preventive maintenance saves 12% to 18% over a purely reactive program. It also estimates that predictive maintenance saves a further 8% to 12% over preventive maintenance alone. These figures come from older studies, so treat them as guides, not promises. Even so, they show the direction: planned work costs less than breakdowns.
Summer temperatures in the UAE touch almost 50°C. Also, heat stresses engines, tyres and cooling systems. Fleets also run across emirates and borders. When a truck breaks down far from the depot, recovery is slow and costly. So accurate, timely maintenance data matters even more in this region.
The key benefits of custom fleet dashboards in the GCC are one shared view of the fleet, faster decisions, clear accountability and lower costs. They also reduce time wasted on phone calls and spreadsheets.
| Benefit | How It Happens | What to Track |
|---|---|---|
| One shared view | Tracking, fuel, maintenance and cost data on one screen | Time spent compiling reports |
| Faster decisions | Live data and alerts replace waiting for reports | Time to resolve an exception |
| Accountability | Each metric belongs to a role and a person | KPIs reviewed on schedule |
| Lower costs | Waste in fuel, idle time and repairs becomes visible | Cost per kilometer |
| Better compliance | Digital logs and inspections stay audit-ready | Inspection completion rate |
However, not everyone needs the same screen. Custom fleet dashboards let you show each role only what matters. For example, dispatchers see live vehicles and ETAs. Workshop teams see services due. Finance sees cost per vehicle. As a result, people act faster because they are not searching.
Instead, a good dashboard highlights problems, not every vehicle. Alerts for idle limits, geofence breaches, harsh events and maintenance due draw attention to what needs action. Managers then spend time fixing issues instead of watching a map.
When operations, maintenance and finance use the same data, arguments stop. En Route’s unified data model consolidates work orders, parts inventory and asset performance data into a single source of truth, and its multi-site reporting brings branches into one view. See the fleet management system for more.
Automated reporting tools help UAE fleet operations by saving time, reducing errors, delivering reports on schedule and keeping records audit-ready. People then spend their hours on decisions, not data entry.
Because manual reports mean copying numbers between systems, each copy adds delay and risk. In a 2025 survey of equipment fleets, about 75% still relied on manual logs, alone or alongside digital tools. Automated reports pull data directly from the source, so they are faster and more accurate.
Automated tools can deliver reports on a set schedule, such as daily fuel and idle summaries or weekly maintenance backlogs. So managers receive the numbers without asking. That rhythm builds a habit of review and follow-up.
The UAE Federal Tax Authority requires businesses to keep corporate tax records for at least seven years after each tax period. Automated systems create time-stamped records with an audit trail. En Route’s platform also digitizes compliance workflows, including electronic logbooks, pre-trip inspection forms and driver journals. See vehicle inspections and the driver app.
Also, automation exposes hidden costs sooner. Fuel trends, idle hours and repair spend show up as soon as they happen. For example, fuel monitoring system spots deficiencies early, and Eco-Driving shows which driving habits add cost.
En Route Technologies offers custom fleet dashboards built on customizable dashboards, ready-made reports, role-based permissions and multi-site views. They suit logistics, freight, delivery and other fleet operations across the UAE.
En Route’s reporting and analytics tools offer customizable dashboards and out-of-the-box reports. They show financial insights, such as total cost of ownership, and operational insights, such as asset performance. Teams can start fast with ready-made reports and then tailor them to their needs.
Custom user permissions let each person see only the right data. For example, a depot supervisor can see local vehicles, while head office sees the whole fleet. This protects sensitive information and keeps screens clear.
Large logistics companies run several depots, branches or countries. Multi-site reporting brings them into one view, so managers can compare sites with the same measures.
To see how these fit freight operations, visit En Route’s logistics and freight solutions.
Automated fleet reports should track fuel per 100 km, idle time, cost per kilometer, utilization, maintenance compliance, unplanned downtime and driver safety events. These KPIs show where money leaks and where to act. Strong custom fleet dashboards put them front and center.
| KPI | How to Calculate | What You Do with It |
|---|---|---|
| Fuel per 100 km | Liters used ÷ kilometers × 100 | Find thirsty vehicles and wasteful habits |
| Idle percentage | Idle hours ÷ engine hours | Set idle limits and coach drivers |
| Cost per kilometer | Total vehicle cost ÷ kilometers | Compare vehicles, routes and customers |
| Utilization rate | Productive hours ÷ available hours | Reassign or retire low-use vehicles |
| Maintenance compliance | Services done on time ÷ services due | Prevent breakdowns |
| Unplanned downtime | Hours out of service without notice | Fix root causes and plan servicing |
| Harsh events per 1,000 km | Harsh events ÷ kilometers × 1,000 | Target coaching and cut accident risk |
| On-time delivery rate | Deliveries on time ÷ total deliveries | Improve routes and schedules |
Fuel is usually the largest variable cost. The U.S. Department of Energy says an idling heavy truck burns about 3 liters an hour. At the October 2026 UAE diesel price of AED 4.80 per liter, that is about AED 14 for each hour of idling. So an idle-percentage KPI pays for itself quickly.
Track the share of services done on time and the hours lost to unplanned stops. When compliance rises and downtime falls, repair bills usually fall too. Then use these numbers to justify servicing budgets.
Harsh braking, speeding and idling raise fuel use and risk. Eco-Driving turns them into driver scores. On the route side, plan-versus-actual views and the scheduled route service show where trips slip.
En Route provides real-time fleet analytics by streaming live GPS, engine and sensor data into one platform and turning it into dashboards, alerts and reports. Backed by 20 years of market expertise, it serves enterprise fleet owners across the GCC. These real-time custom fleet dashboards update as the fleet moves.
Vehicles send location, speed, fuel and engine data to the cloud. En Route can refresh locations as often as every 1 to 2 seconds, depending on configuration. The platform also reads fault codes, tyre pressure and axle load data, so maintenance and safety teams see issues early.
However, raw data is not enough. The platform turns sensor data into business intelligence through dashboards, alerts and reports. AI-powered analytics support predictive maintenance, so work orders can start before a failure. Event alerts reach people through several channels.
Regional fleets face heat, long distances and local rules, so local expertise matters. En Route is a UAE-based provider with SIRA SecurePath Premium approval and ISO 9001:2015 certification. See its certifications and compliance page for details.
Cloud-based dashboards let managers see vehicles from one place, wherever they operate. Each GCC country has its own tracking and approval rules, and En Route’s approvals are UAE-specific. So confirm local requirements for each country on your routes.
Look for custom fleet dashboards with configurable widgets, role-based access, drill-down detail, live maps, smart alerts, scheduled reports, open APIs and mobile access. Also check how easily your own team can change them.
However, dashboards are only as good as their data. Look for hardware-agnostic platforms that connect many device types and sensors. Also check for an open API and links to ERP, BI and accounting tools. Historical data logs matter too, because trends need history.
| Feature | Why It Matters | Question to Ask |
|---|---|---|
| Customization | Every fleet measures success differently | Can my team build its own views? |
| Permissions | Protects data and cuts clutter | Can I limit views by depot or role? |
| Alerts | Turns data into action | Which events trigger alerts, and how are they sent? |
| Scheduled reports | Saves time and builds routine | Can reports go out automatically? |
| Integration | Avoids double entry | Which ERP, BI and accounting systems connect? |
| Support | Keeps the system useful | What local support and training do you offer? |
En Route integrates automated reports with existing fleet tracking systems through a hardware-agnostic platform, an open API and links to ERP, BI and accounting systems. You do not need a costly rip-and-replace overhaul. Your current devices keep working, and your custom fleet dashboards gain new data.
En Route’s telematics and IoT platform is hardware-agnostic. It is built to integrate with thousands of GPS device models and sensors from manufacturers worldwide. It connects simple plug-and-play OBD trackers and complex machinery with advanced CAN bus inputs through the same architecture.
Also, integration removes double entry. Cost data can flow to accounting. Utilization and delivery data can flow to BI tools. Maintenance and parts data can flow to ERP. As a result, every team works from the same numbers.
Good reports need clean data. First, use one ID for each vehicle and driver in every system. Check time zones and units. Also review a few reports against raw records each month. Because driver and location data are personal data under the UAE Personal Data Protection Law, limit access and keep a written policy.
Custom fleet dashboards turn scattered fleet data into clear, role-based answers. They replace paper maintenance schedules, automate reports and highlight the KPIs that cut cost. For UAE logistics companies, they also support audits, compliance and faster decisions.
First, start with three dashboards: one for dispatch, one for maintenance and one for cost. Then automate the reports your managers read most. Then expand. En Route Technologies brings tracking, maintenance and reporting together on one platform. Explore the fleet management system or contact the team to plan your dashboards.
They show live fleet data and KPIs for each role on one screen, so teams spot problems early and act faster. They also replace manual spreadsheets, cut reporting time and make costs visible.
A reporting tool reads mileage, engine hours and fault codes from the vehicle and creates reminders and work orders automatically. Paper schedules depend on memory and often miss services.
Track fuel per 100 km, idle percentage, cost per kilometer, utilization, maintenance compliance, unplanned downtime, harsh events per 1,000 km and on-time delivery rate.
Yes. En Route’s reporting tools offer customizable dashboards and custom user permissions, so dispatchers, workshop teams, finance and management each see the right data.
It depends on the hardware and configuration. The En Route platform can refresh vehicle locations as often as every 1 to 2 seconds while a vehicle is moving.
Yes. The platform is hardware-agnostic and integrates with thousands of GPS tracking system device models and sensors. It also offers an open API and integration with ERP, BI and accounting systems.
The Federal Tax Authority requires businesses to keep corporate tax records for at least seven years after each tax period. Keep fleet cost and maintenance records that support your accounts for at least that long, and confirm details with your adviser.
A cloud-based dashboard can bring vehicles from several countries into one view. Each country has its own tracking and approval rules, and En Route’s approvals are UAE-specific, so check local requirements and discuss them with the team.
Book a demo to see custom fleet dashboards, automated reports and real-time analytics working for your logistics operation.